
Hunting MongoBleed (CVE-2025-14847)
Detecting CVE-2025-14847 Exploitation with Velociraptor

CVE-2025-14847 dropped recently and it’s a nasty one. Dubbed “MongoBleed” by the security community, it’s a memory disclosure vulnerability in MongoDB’s zlib decompression that allows attackers to extract sensitive data—credentials, session tokens, PII—directly from server memory. No authentication required. If you’re running MongoDB in production, you need to pay attention to this.
Patches are available, and you should apply them immediately if you haven’t already. But patching alone isn’t enough—you need to know if you were exploited before the patch. That’s where detection comes in.
After reading Kevin Beaumont’s excellent writeup on the vulnerability, I got to work building detection capabilities. As far as I know, this is currently the only defensive signature for CVE-2025-14847 that exists (as of this post being published). The result is a Velociraptor artifact for live hunting, with KAPE Targets for triage forensic collection coming soon.
What will make this CVE particularly challenging for blue teams is that it seems to be only detectable in the MongoDB server logs which are extremely unlikely to be shipped to any SIEM, and it requires somewhat complex logic which could be tricky to port into most SIEM detection engines. Fortunately, Velociraptor was a quick fix to both of these challenges.
Let me walk you through the vulnerability, the detection logic, and how I validated it against real attack traffic.
What is MongoBleed?
MongoBleed exploits a flaw in how MongoDB handles zlib-compressed network messages. When compression is enabled (which it often is for performance), an attacker can craft connections that cause the server to leak chunks of its memory in responses. Think Heartbleed, but for MongoDB.
The affected versions span multiple major releases:
8.2.x: 8.2.0 - 8.2.2 (fixed in 8.2.3)
8.0.x: 8.0.0 - 8.0.16 (fixed in 8.0.17)
7.0.x: 7.0.0 - 7.0.27 (fixed in 7.0.28)
6.0.x: 6.0.0 - 6.0.26 (fixed in 6.0.27)
5.0.x: 5.0.0 - 5.0.31 (fixed in 5.0.32)
4.4.x: 4.4.0 - 4.4.29 (fixed in 4.4.30)
4.2.x: 4.2.0 and later (no fix)
4.0.x: 4.0.0 and later (no fix)
3.6.x: 3.6.0 and later (no fix)
That’s a lot of potentially vulnerable MongoDB instances out there.
The Attack Pattern
Here’s where it gets interesting from a detection standpoint. The exploit works by establishing many rapid connections to the MongoDB server—we’re talking tens of thousands per minute. Each connection probes for memory leaks, and the attacker aggregates the leaked data to reconstruct sensitive information.
But here’s the key insight: the exploit never sends client metadata.
Every legitimate MongoDB driver—whether it’s PyMongo, the Node.js driver, mongosh, or any other—sends a “client metadata” message immediately after connecting. This metadata includes the driver name, version, operating system, and application name. MongoDB logs this as event ID 51800.
The MongoBleed exploit? It connects (event ID 22943), does its thing, and disconnects (event ID 22944). No metadata. Ever.
This gives us a reliable detection signal: a source IP with hundreds or thousands of connections but zero metadata events is almost certainly not legitimate traffic.
Note: The behavior I described above reflects the behavior of the current public proof-of-concept exploit. A motivated attacker could modify the exploit to send fake client metadata after connecting, making the traffic appear more legitimate. However, the extreme connection velocity (100,000+ connections/minute) would remain difficult to mask without significantly reducing exploitation speed—creating a trade-off between stealth and effectiveness. Defense in depth applies: patch vulnerable systems rather than relying solely on behavioral detection.
Building the Detection
The Velociraptor artifact I created—Linux.Detection.CVE202514847.MongoBleed—implements a multi-faceted detection approach:
Parse MongoDB JSON logs for connection events (22943), metadata events (51800), and disconnection events (22944)
Aggregate by source IP within a configurable time window
Calculate the metadata rate—what percentage of connections sent metadata?
Calculate connection velocity—how many connections per minute?
Apply risk scoring based on the combination of factors
The risk levels break down like this:
HIGH: ≥100 connections AND <10% metadata rate AND ≥500 conn/min
MEDIUM: ≥100 connections AND <10% metadata rate (lower velocity)
LOW: ≥100 connections (normal metadata rate)
INFO: <100 connections
The velocity component is important. Without it, you might flag a misconfigured application that made 100 connections over several hours without proper driver initialization. With velocity factored in, we’re looking for the characteristic burst pattern of the exploit—100,000+ connections per minute.
Testing Against Real Attack Traffic
I wasn’t about to release a detection artifact without validating it against actual exploitation. So I set up a lab environment:
Spun up a vulnerable MongoDB 8.2.2 container with zlib compression enabled
Deployed a Velociraptor server and installed the Linux client inside the container
Ran the mongobleed POC against it
Collected the artifact and checked the results
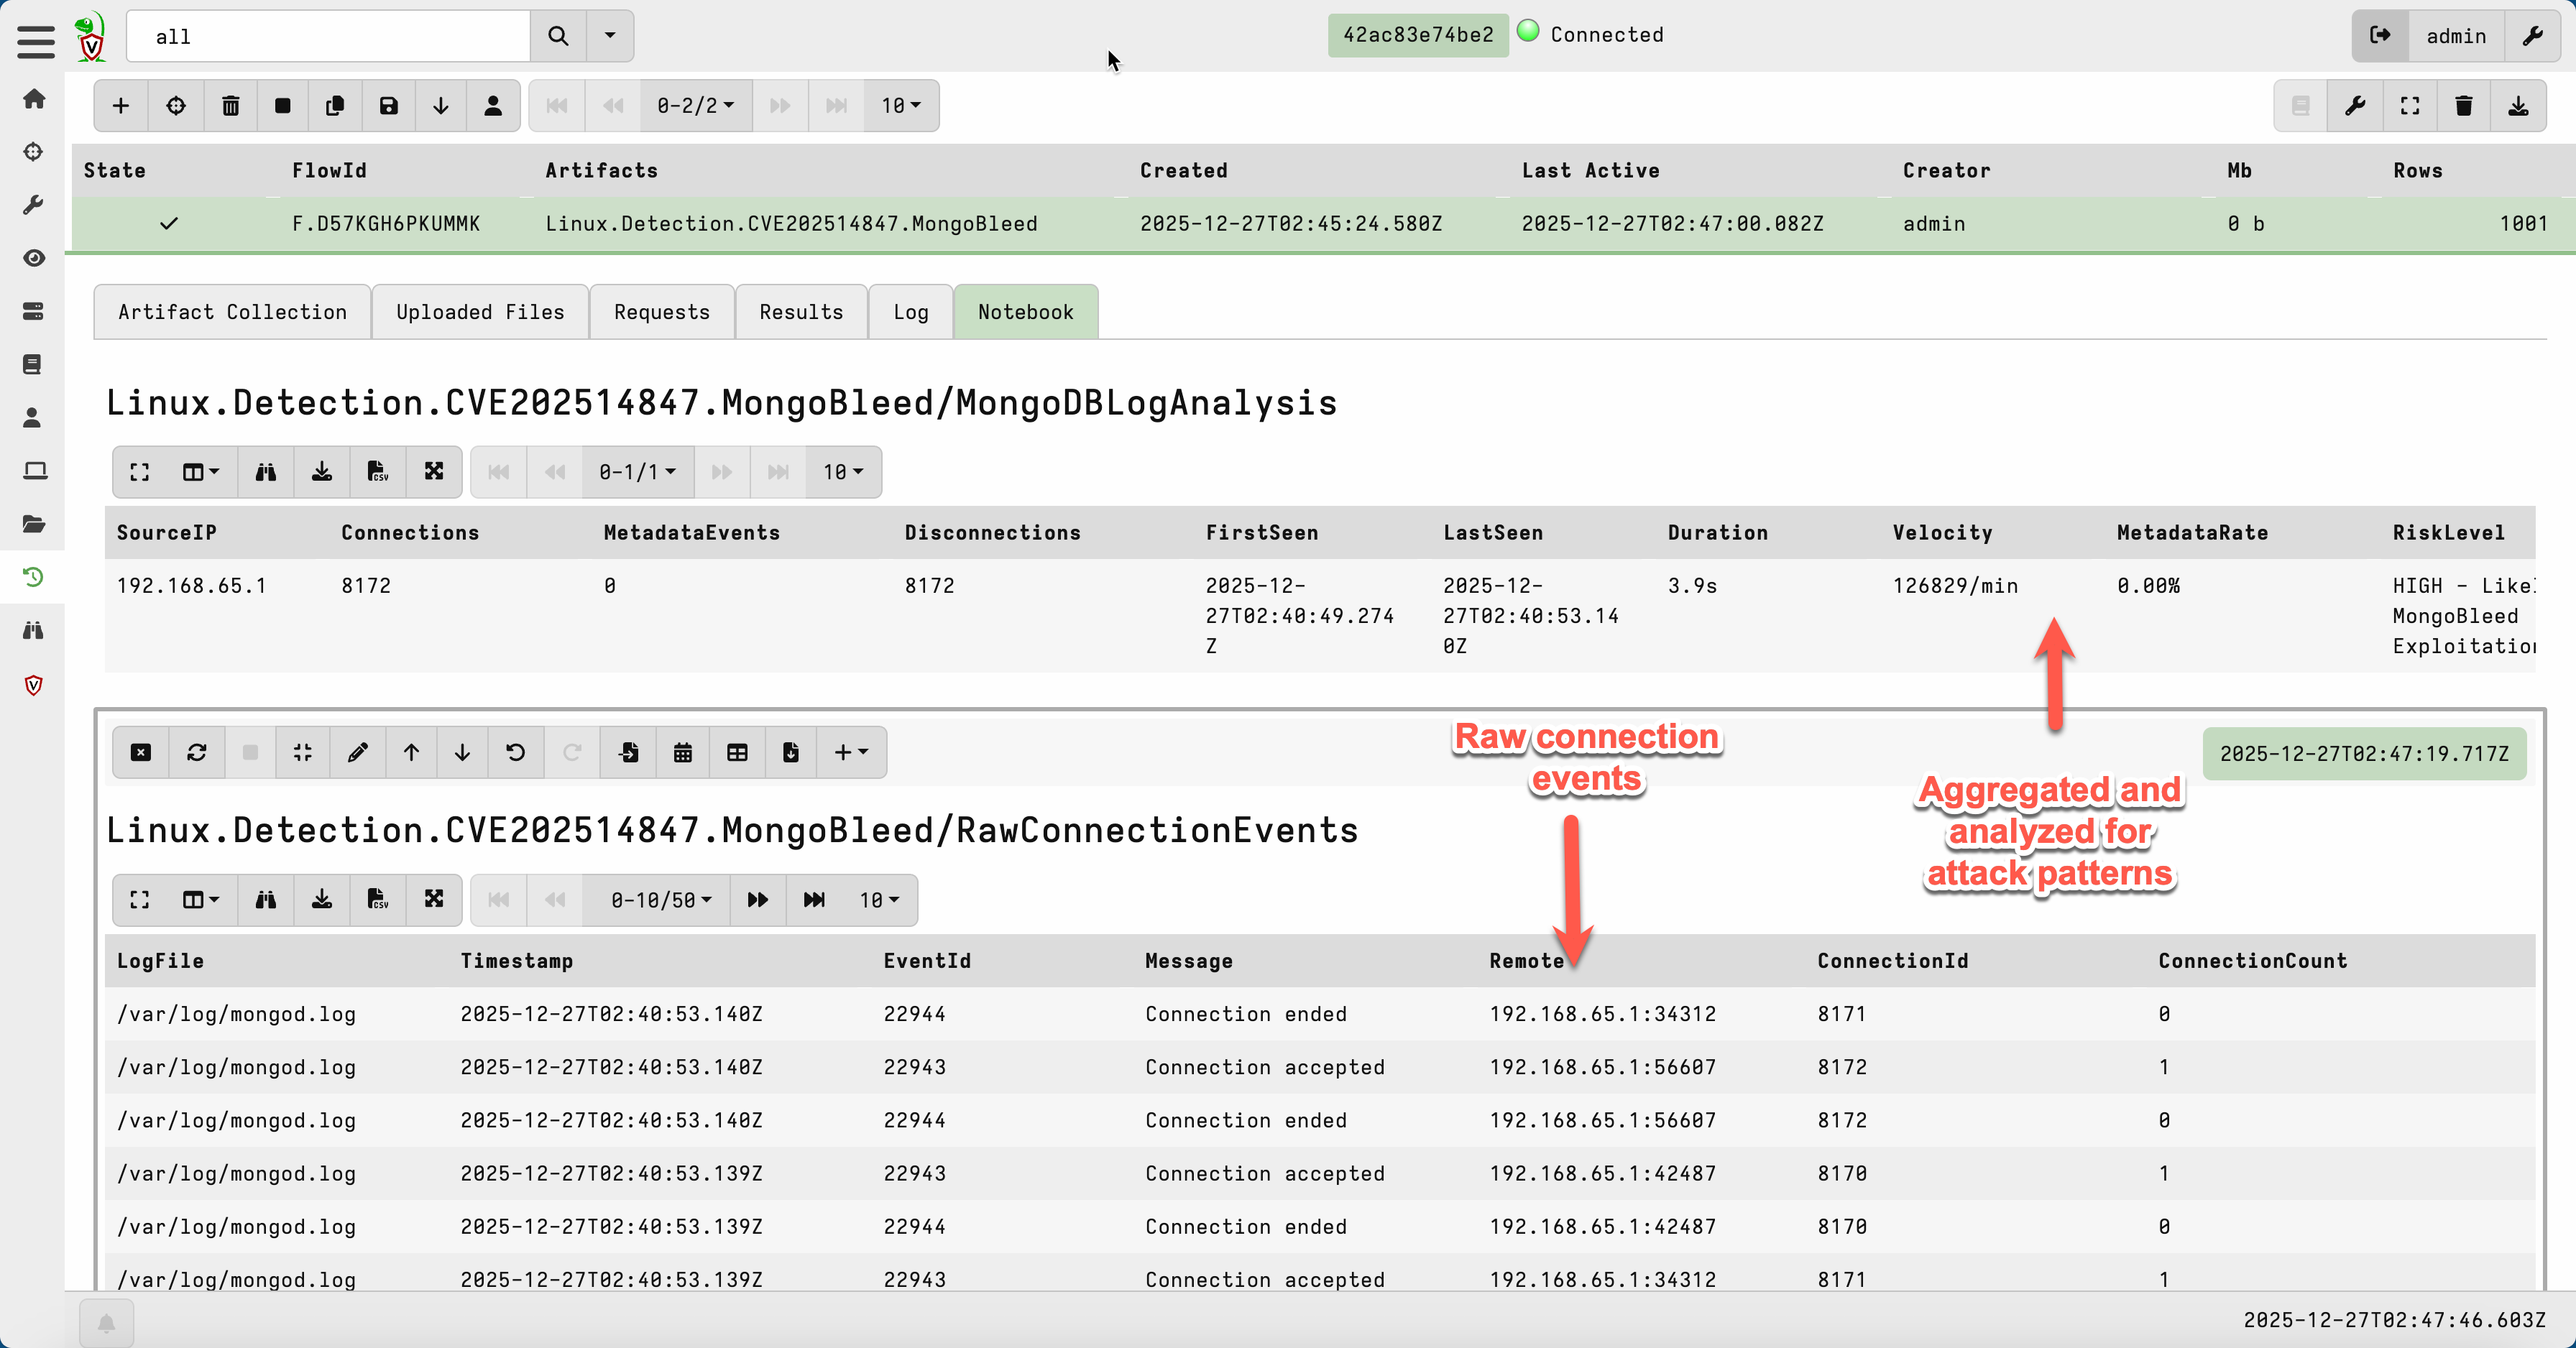
Here’s what the exploit traffic looked like:
Connections: 499
Metadata Events: 0
Duration: 0.3 seconds
Velocity: 111,716 connections/min
Metadata Rate: 0.00%
Risk Level: HIGH - Likely MongoBleed Exploitation
Detection confirmed. The artifact correctly flagged the attack with HIGH confidence.
I repeated this across MongoDB 6.0, 7.0, 8.0, and 8.2 to ensure the log format was consistent and detection worked across all vulnerable versions. It did.
But What About False Positives?
Any detection is only as good as its false positive rate. To validate the thresholds, I analyzed several days of production MongoDB logs from real-world deployments. The results were reassuring:
Production (Legitimate Traffic):
Velocity: 0.2 - 3.2 conn/min
Metadata Rate: 99 - 100%
Daily Volume: 300 - 4,500 connections
Attack Traffic:
Velocity: 100,000+ conn/min
Metadata Rate: 0%
Volume: 499 connections in 0.3 seconds
The difference between legitimate and attack traffic is 3-5 orders of magnitude. That’s a comfortable margin. Legitimate applications consistently send metadata with every connection, and their velocity is measured in single-digit connections per minute, not hundreds of thousands.
A caveat: I only had access to a handful of production MongoDB log sets to validate against. Your environment may look different—high-throughput applications, connection pooling behavior, or unusual driver configurations could shift these patterns. The default thresholds should be a sane starting point, but don’t be afraid to tweak the parameters if you’re seeing unexpected results. That’s what they’re there for.
Using the Artifact
The artifact provides three data sources:
MongoDBLogAnalysis: Parses log files from disk at standard paths (
/var/log/mongodb/*.log*, etc.)DockerMongoDBLogs: Parses logs from Docker containers when you specify a container pattern
RawConnectionEvents: Returns individual connection events for detailed investigation
The Docker source is smart about not executing unnecessarily—if you don’t specify a container pattern or Docker isn’t running, it skips entirely. No wasted cycles.
Key parameters you might want to tune:
TimeRangeMinutes: How far back to look (default: 60 minutes)ConnectionThreshold: Minimum connections to flag (default: 100)VelocityThreshold: Minimum connections/minute for HIGH risk (default: 500)DockerContainerPattern: Container name pattern if running MongoDB in Docker
Assumptions and Limitations
A few things to keep in mind:
JSON logging is required. MongoDB 4.4+ defaults to JSON-formatted logs, which is what this artifact parses. If you’re running an older version with legacy text logs, this won’t work out of the box.
Log retention matters. The artifact can only analyze logs that exist. If your MongoDB logs rotate aggressively or the attacker clears them, you’ll miss the evidence.
This is Linux-only. While MongoDB runs on Windows, the vast majority of production deployments are on Linux. The artifact has a precondition limiting it to Linux systems.
Get the Artifact
The artifact is published on the Velociraptor Artifact Exchange. You can import it directly into your Velociraptor deployment and start hunting immediately using the Server.Import.ArtifactExchange server artifact.
If you’re running MongoDB in your environment, here’s what I’d recommend:
Patch now if you haven’t already. The fixed versions are 8.2.3, 8.0.17, 7.0.28, and 6.0.27.
Run this artifact against your MongoDB servers to check for exploitation attempts—even if you’ve patched, attackers may have hit you before the fix was applied.
Check your log retention. If you only keep a few hours of logs, you may have already lost evidence. Consider extending retention for security-critical systems.
This vulnerability is trivial to exploit and the POC is public. If your MongoDB instances were internet-exposed with compression enabled, assume you were scanned at minimum.
References
Kevin Beaumont’s MongoBleed Writeup — the post that kicked off this research
Happy hunting.
Want to learn to wield Velociraptor like a pro? Check out our on-demand training: Threat Hunting & Incident Response with Velociraptor
