VMware Memory Analysis with MemProcFS
A lab guide for analyzing an infected memory image of a running VMware system with MemProcFS.
Let’s get hands-on with one my favorite memory analysis tools, MemProcFS by Ulf Frisk.
I highly recommend watching this video demo by Ulf Frisk which outlines a lot of what we’re about to do and will give you a solid primer on the capabilities of the tool.
In this guide, we’ll make a little noise on a Windows VM running in VMware Workstation, and use MemProcFS to analyze the memory image of the compromised running VM.
Prepare the lab environment
To get started, you’ll need the lab environment (both VMs) I outline in this post, but feel free to skip the LimaCharlie step as we won’t be using it for this guide. No harm in doing it as it only adds to the fun to be able to see EDR telemetry of what we’ll do next.
If you are using the same Windows VM you deployed from a previous lab some time ago, it may be expired at this point and you need to pull down a new one or else it will shut itself down periodically.
Once your lab environment is setup, complete only the following steps of this post:
At this point, you should have an active Sliver implant on your Windows VM. Leave it running, now let’s prep our host system to use MemProcFS.
Install MemProcFS on your host
For the purpose of this guide, I am assuming your host system is Windows. If you are using a different host OS, you’ll need to adapt these steps for your host. This needs to be accomplished on the host so that MemProcFS has direct access to VMware running on the host.
On your host system (not within a VM), download MemProcFS 5.6.5 from GitHub with the link below. I am hardcoding the version we use for the purpose of the guide, but latest releases can be found here.
Unzip it to a location you can easily find later.
Download and install Python 3.11
Download and install Dokany, a dependency that MemProcFS uses to mount memory images as file systems.
Do Evil Things on your Windows VM
With the Sliver session we should have open from previous steps, let’s interact with the session and do something that will look interesting in memory.
Currently, our C2 implant is running as it’s own process with the name of whatever Sliver generated when you created your payload. Not only is this suspicious if someone else were to look at running processes, but it’s volatile as someone may terminate that process.
Let’s get some information about the privileges our C2 session currently has on the victim
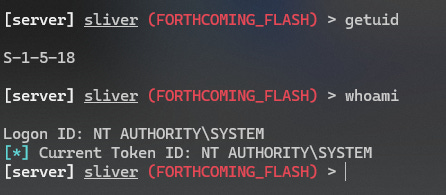
getuidwhoamiNotice, we’re running as the “User” account on the machine. While this account has admin rights, a more powerful user context to run under would be “System” — one easy way to achieve this is to inject into a process that is already running as system.
Examine the process tree on the victim, and see what process you are running as by running the following command in Sliver within your C2 session.
ps -TLet’s be extra shady, and inject another C2 implant into the security tool we see running on the system “
Sysmon64.exe” — there is a very good chance this process is running with higher privileges than we currently have.Take note of the Process ID your instance of Sysmon64 is running as, in my case it is
7148
Let’s “migrate” our C2 payload into the running sysmon process
migrate <sysmon_pid>If your migrate command succeeds, a new C2 session will open from the victim, now running inside of the Sysmon64 process.
Switch into the new C2 session
use <new_session_id>Now let’s check our privileges again
getuidwhoamiNotice we are now running in the System user context, which is the most powerful account on a single machine.
To add some interesting activity for analysis, let’s drop to an interactive shell in our new C2 session running inside of Sysmon64
shellType Y and hit enter to confirm
We are now in a PowerShell session on the victim
whoamiGet-ProcessWhile there are many things we could do from here, we likely have enough to make our memory analysis interesting. So let’s switch back to our host and begin the process of mounting and analyzing the Windows VM’s memory.
Analyze Memory with MemProcFS
Switch back to your Windows host system and let’s launch MemProcFS.
In an administrative PowerShell prompt, change to the location you unzipped MemProcFS.
cd C:\path\to\MemProcFS_directoryInspect the help output
.\MemProcFS.exe -hTake specific note of the entries at the end which describe the usefulness of the
-forensicand-forensic-yara-rulesoptions as we’ll be using both.
Let’s download a Yara rule that specifically looks for Sliver C2 implants. Run the following command in your PowerShell console
IWR -Uri https://raw.githubusercontent.com/Neo23x0/signature-base/master/yara/gen_gcti_sliver.yar -Outfile gen_gcti_sliver.yarNow that our Yara rule is staged, we’re ready to run MemProcFS to mount the memory image of our running Windows VM victim
.\MemProcFS.exe -device vmware -forensic 1 -forensic-yara-rules ".\gen_gcti_sliver.yar"MemProcFS will prompt you to decide which VM you want to mount memory from. We want to choose the VM-ID that is associated with our Windows VM. In my case, it’s fairly simple since I know the Linux VM has 2GB of RAM and the Windows VM has 8GB.
Enter your VM-ID and press ENTER
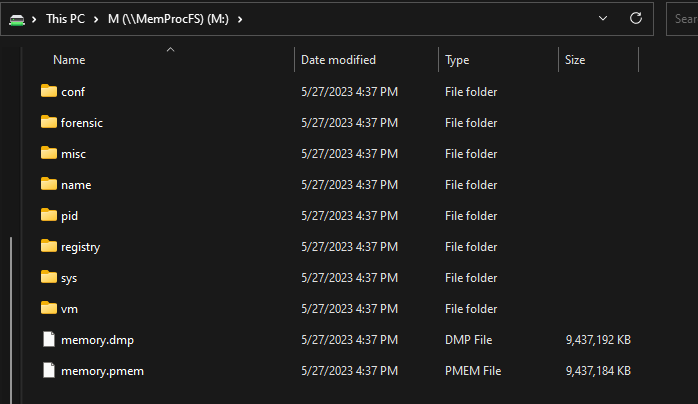
The following output means that our memory is now mounted at drive letter M:\ on our host system
Analyze Memory
On your host system, browse to the newly mounted M: drive.
There are many awesome things available to you here, as you have essentially mounted memory of a running machine as if it was a basic file system. Start by looking at basic information such as the running processes on the system
Browse to
M:\sys\procand openproc.txtSearch for your interesting process names such as your Sliver EXE or the process we migrated into:
Sysmon64
Browse to
M:\sys\netand open netstat.txtTwo easy search terms here: suspicious processes (implant or sysmon) or simply the IP address of the suspected C2 server
Notice many CLOSED and a couple ESTABLISHED connections to our C2 IP address from the Sliver generated EXE as well as from Sysmon64. This is highly unusual as Sysmon should rarely, if ever, be communicating on the network.
Now let’s get to the good part… Remember how we asked MemProcFS to run a Yara scan for Sliver C2? Let’s see if it found any hits.
Browse to M:\forensic\yara and open match-count.txt — this simply tells us if there were any matches for our signature. In my case, there were 4 matches.
To get a closer look at the matches, let’s open M:\forensic\yara\result.txt
Notice how easily we were able to find this C2 implant with a simple yara scan.
Now let’s better try to understand why Sysmon64 is triggering detections for Sliver by looking for code injection. This is another feature of the
-forensicoption we enabled, which automatically looks for suspicious activity like signs of possible injection which we accomplished with ourmigratecommand.Browse to
M:\forensic\findeviland openfindevil.txtWhile this file is a bit challenging to interpret at first, it will often contain evidence of code injection due to the many behaviors we see when one process injects code into another. Unfortunately, its also a bit prone to false positives so it takes time to get comfortable with interpreting these results to quickly find evil. One solid universal tip is: “Start with things you already suspect are bad,” so let’s search for entries related to Sysmon64.
In my output, I’ve filtered down to things I already suspect… While there are many indications of possible injection here, I’ve highlighted the lower false-positive prone detections looking for memory sections with unusual read-write-execute (RWX) or read-execute (RX) permissions. Read more about the detection types here.
There are so many incredibly useful things you can further examine from this memory image. Here is some inspiration to consider furthering your knowledge
Examine
M:\forensic\timeline\timeline_all.txtsearching for your known IOCsExamine M:\forensic\timeline\timeline_net.txt and understand the beacon behavior of your C2 implants
Examine process objects by navigating to them by name under M:\name\<process_name>
Try this with your Sliver EXE — you can pull the EXE right out of memory by browsing to
M:\name\<process_name>\modules\<process_name>.exe\and copying out thepefile.dllWarning, this is your actual C2 implant so be careful not to trigger antivirus on your host!
Congrats, you’ve analyzed a memory image!
I hope you enjoyed this very brief primer on MemProcFS. I strongly recommend pursuing additional knowledge with the resources listed on the project’s GitHub: https://github.com/ufrisk/MemProcFS#get-started
Happy hunting!


